

A crypto chart can look like a wall of red and green noise at first. It is actually a record of every fight between buyers and sellers. Once you know what to look for, a chart tells you where price has been, where it struggled and where it might react next. Here is how to read crypto charts without getting overwhelmed.
Understanding Candlestick Charts
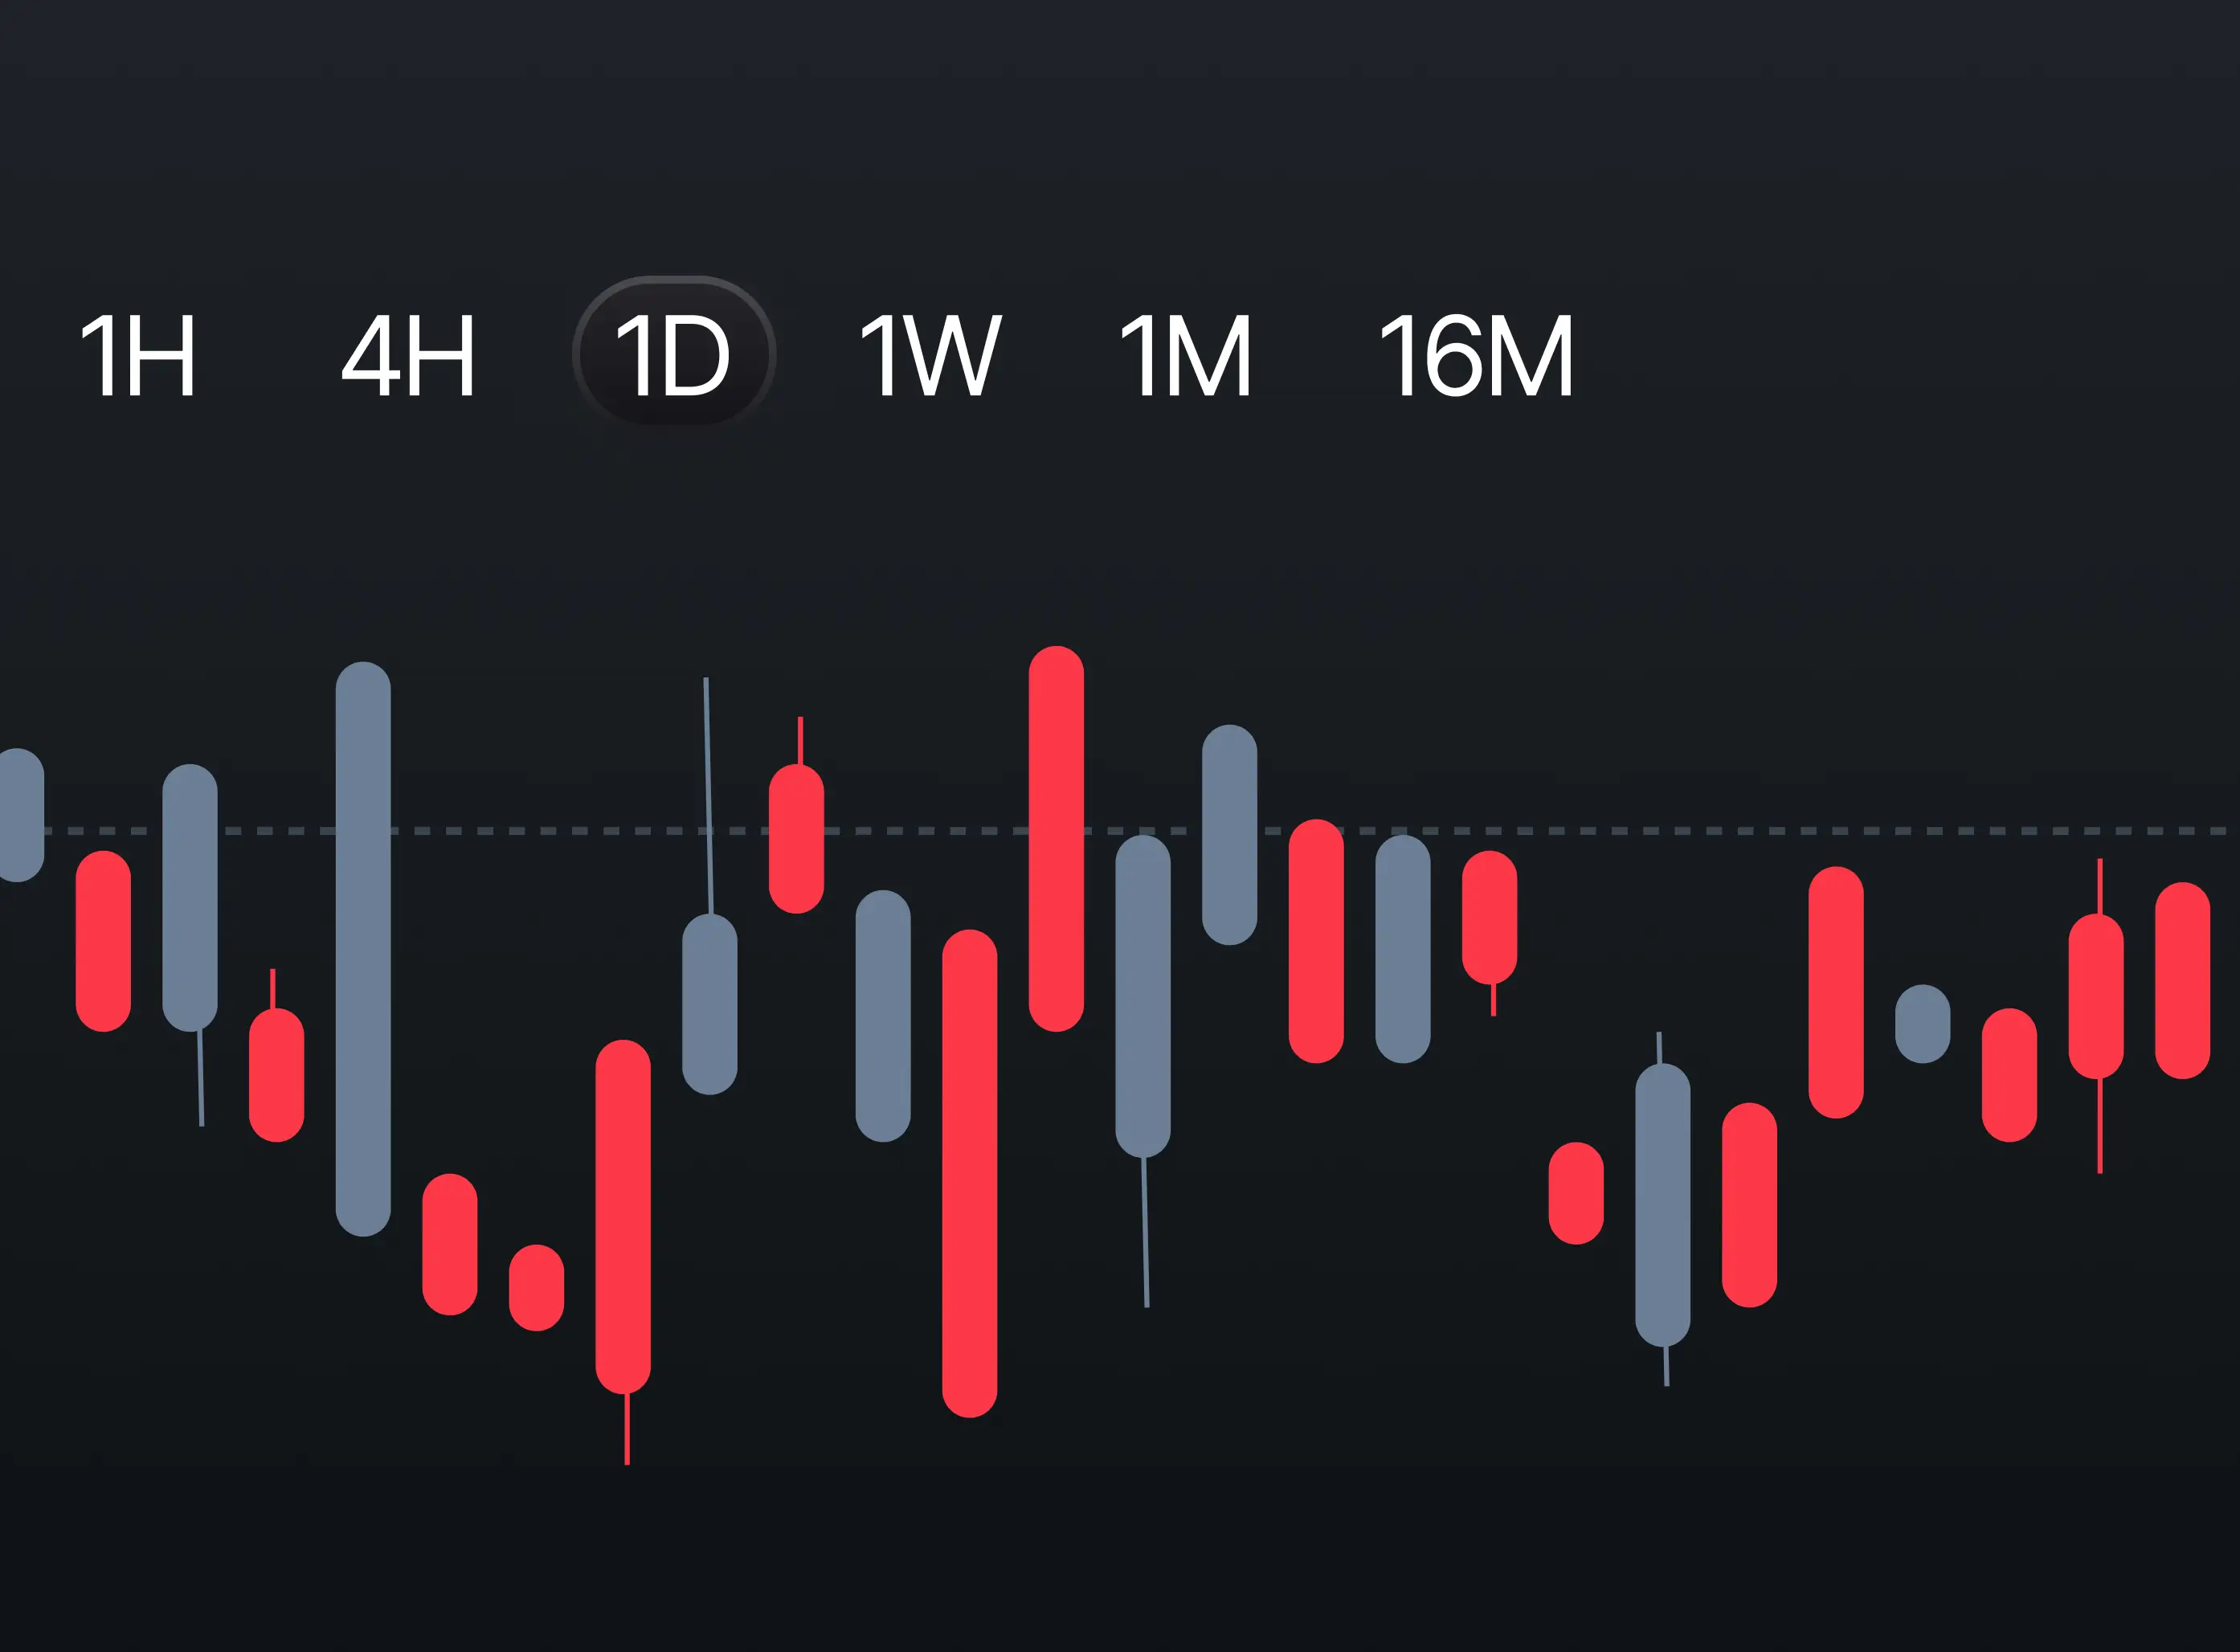
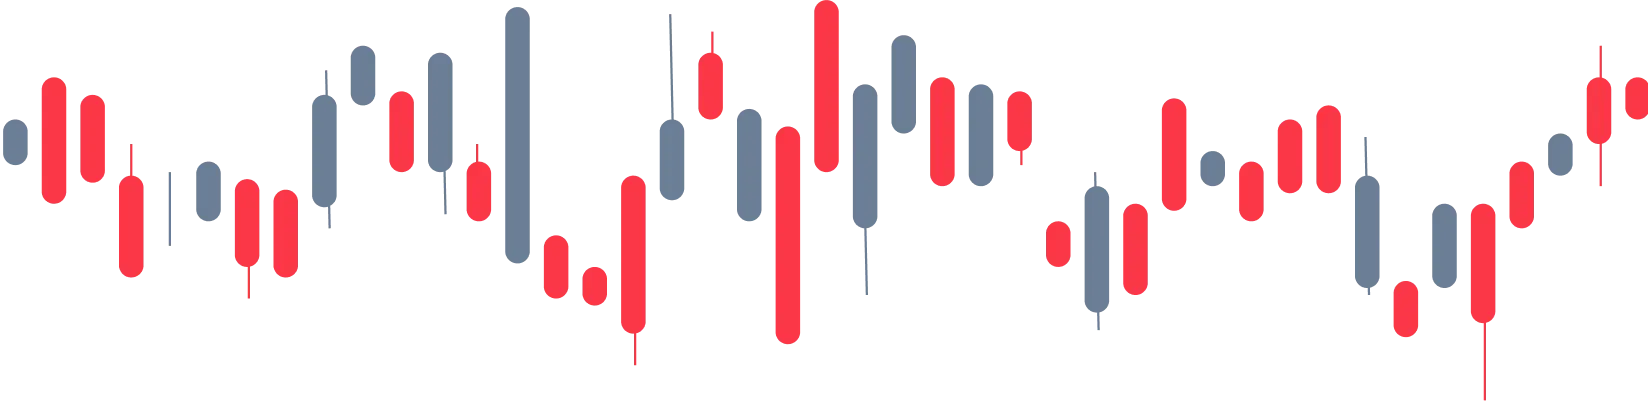
Most traders use candlestick charts. Each candle shows four prices for one time period:
- Open: price at the start of the period
- Close: price at the end
- High: the highest price reached
- Low: the lowest price reached
The thick part is the body, from open to close. The thin lines are wicks, showing the high and low. A green candle closed higher than it opened; a red candle closed lower.
What Candle Shapes Tell You
A long green body means buyers were in control. A long upper wick means buyers pushed price up but sellers forced it back down. A small body with long wicks on both sides, often called a doji, shows indecision. Single candles are clues, not signals, so read them in context.
Choosing the Right Timeframe
Each candle can represent one minute, one hour, one day or one week. Higher timeframes show the bigger picture and carry more weight. A practical approach: check the daily chart for direction, then the 4-hour or 1-hour chart for timing.
Spotting the Trend
Draw a line under the lows and over the highs:
- Higher highs and higher lows: uptrend
- Lower highs and lower lows: downtrend
- Flat highs and lows: range
Trading with the trend is usually easier than fighting it. Our list of cryptocurrency trading strategies shows how different styles use trends and ranges.
Finding Support and Resistance
Support is a price area where buying has stopped falls before. Resistance is where selling has stopped rises. Treat them as zones, not exact prices.
How to Mark Key Levels
- Open the daily chart.
- Mark obvious swing highs and lows that price reacted to more than once.
- Note round numbers like $60,000 on Bitcoin.
- Watch for flips: broken resistance often becomes support.
These levels are where you plan entries, targets and stops. We explain stop placement around them in how to set a stop loss in crypto trading.
Reading Volume on Crypto Charts
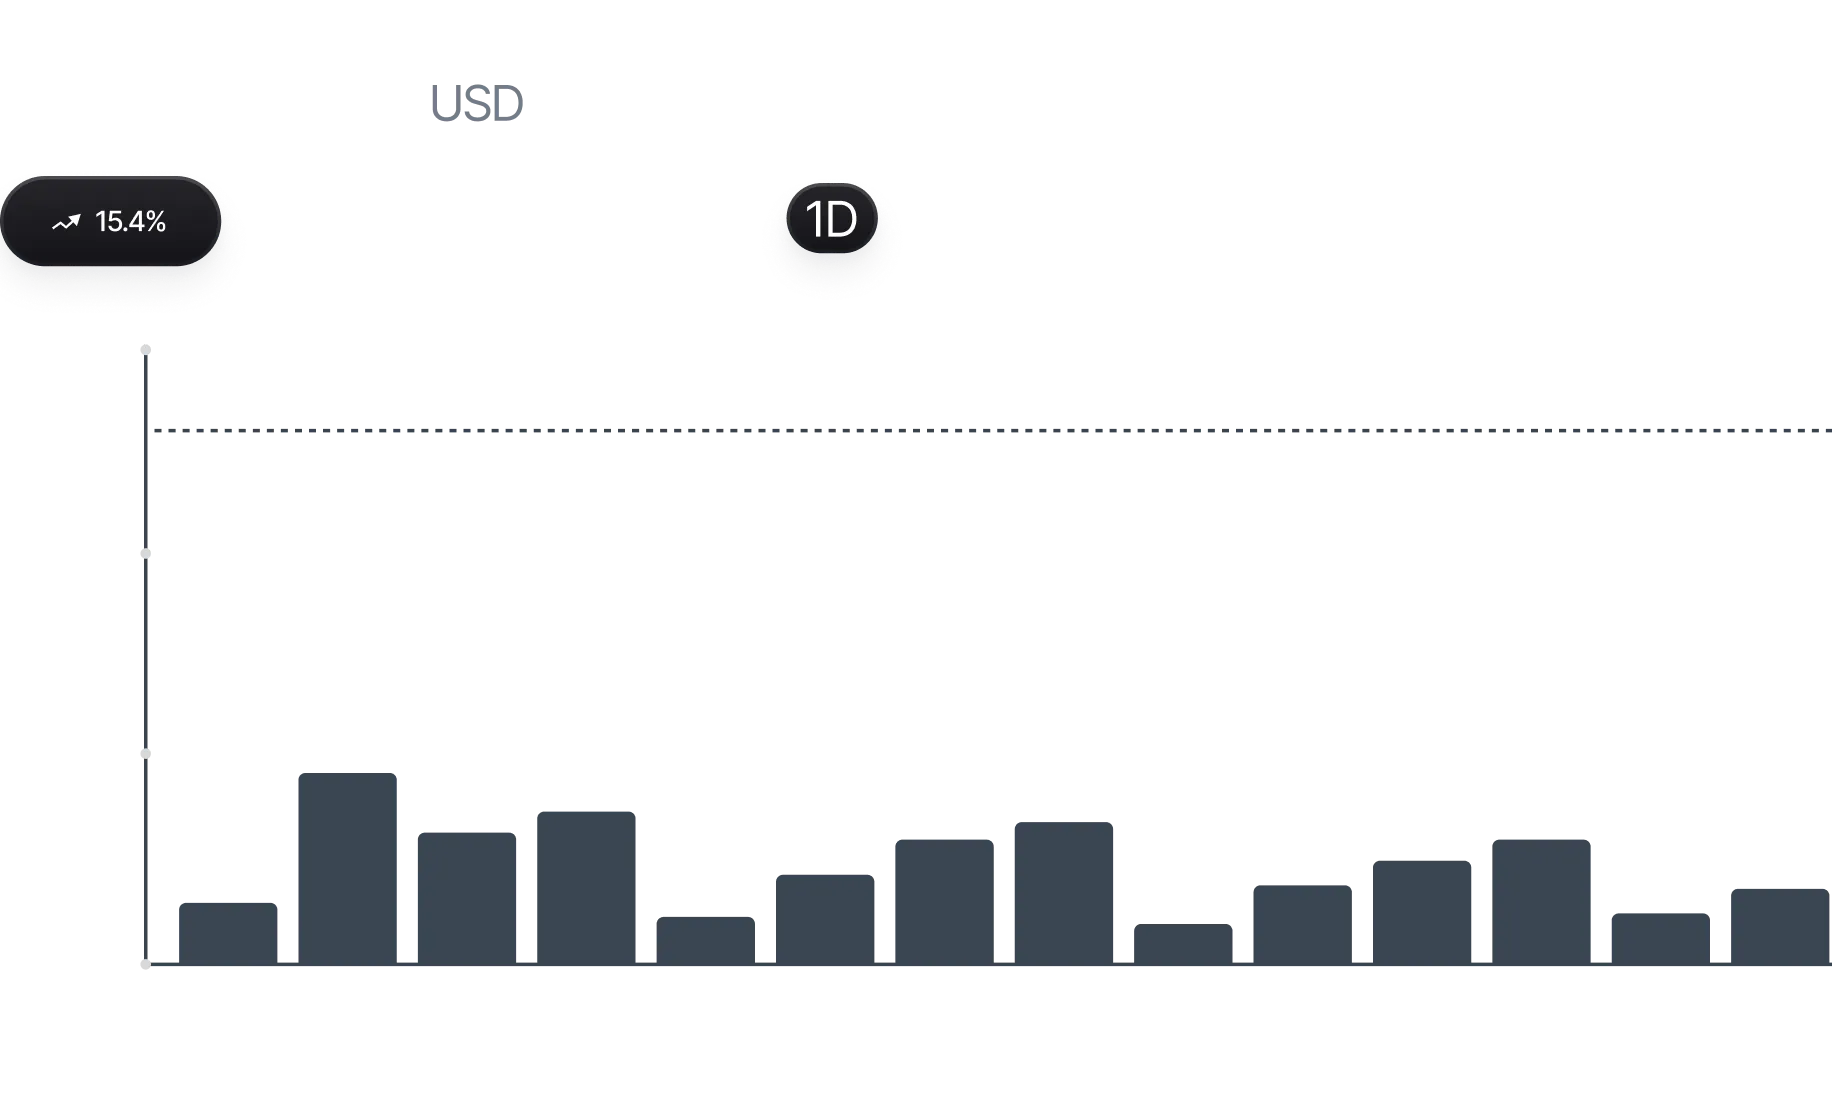
Volume bars sit under the price chart. Rising volume on a breakout suggests real interest. A move on falling volume is more likely to fade. Volume also changes through the day, as shown in the best time of day to trade crypto.
Adding Indicators to Your Chart
Indicators are calculated from price and volume. They can help confirm what you see, but they should not replace reading price itself. Start with a moving average and one momentum tool. Our guides to crypto trading indicators and RSI vs MACD for crypto trading show which ones are most useful.
A Quick Chart-Reading Example
Bitcoin is in an uptrend on the daily chart and pulls back to a zone near $58,000 that acted as resistance last month. A candle forms with a long lower wick and closes green on higher volume. That combination, trend plus support plus a strong rejection candle, is a reasonable long setup with a stop below the zone.
Common Chart-Reading Mistakes
- Staring at 1-minute charts and ignoring the daily trend
- Drawing dozens of lines until nothing stands out
- Treating single candles as guaranteed signals
- Loading ten indicators onto one chart
Next Steps
Chart reading is the foundation of crypto technical analysis. Practise on the Bitcoin daily chart for a week: mark the trend and three key levels each day, then watch how price reacts. If you are brand new, our crypto trading for beginners guide shows where charting fits in the bigger picture.
This article is for educational purposes only and is not financial advice.
New to crypto trading? This guide is part of our Crypto Trading for Beginners: A Complete Starter Guide series.